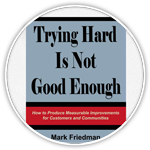
A “turn the curve table” is a group of people who come together with the intention of turning one or more population indicator (or performance measurement) curves. It is a good idea for people working together in this way to have experience with the “Turn the Curve Exercise” and some grounding in RBA (either from an RBA 101 workshop, reading the RBA book or watching the workshop DVD.) Following is some supplementary advice recently given to support the work of several newly formed state level turn the curve tables. References that might identify the specific state have been deleted.
At the start, it is always important to remind people that turning any curve is a hard thing to do. Population level indicator curves require the efforts of many partners, usually take years, not months, and can not be turned through the single cycle development and implementation of a static plan. Sustained efforts and living plans are the only way.
In general, the works groups can benefit by following the steps laid out in the “Turn the Curve” exercise. In fact, this would be a good way to structure some or even most of the first meeting. The turn the curve process is designed to be iterative and so subsequent meetings could constitute successive passes at this process. The best way to think about successive meetings is to address every step in the process at every meeting. At each of these passes the work gets better. The use of time limits on each part of the meeting can help groups develop this discipline.
Following are a few notes on some of these steps that I hope will be helpful.
1. Forecasting: Most people have little experience with forecasting. Forecasting is discussed in some detail on pages 56 to 59 of “Trying Hard Is Not Good Enough.” And there is still more guidance on www.raguide.org. The two most important things to remember about forecasting is that (1) it must be politically credible, and (2) it must represent our best thinking about where the line is headed if we don’t do something more or different (i.e. not where we want to go, but where we are going if we don’t do something to change.) This might involve more than one forecast using different assumptions. However, when multiple forecasts are used, remember that forecasting quickly loses its utility if there is too wide a variance between alternative scenarios.
2. The story behind the baseline: The story is the place where we address causes. There is a natural tendency to give this part of the process short shrift. But the “story” is the diagnostic step in the process. Failure to adequately address the story would be like a doctor prescribing medicine without first diagnosing what is wrong with you. The story need not be about just what is wrong. It should address both what is working and what is not working. The story can and should reflect a rich array of perspectives and there should be an opportunity for a wide range of people to weigh in. This will almost always create a complex picture with competing or even conflicting interpretations. But this is OK. The story does not have to be resolved into a single monolithic consensus before other parts of the process can continue. A rich picture of causes will lead to a much richer discussion about choices for action.
3. What works to turn the curve. This is the part I most wanted to write about, because there is less written guidance on how to have this discussion than for some other parts of the RBA process. It may be helpful to segment the “what works” discussion as follows:
3a. In the Turn the Curve exercise we ask people to wear different hats so that a broader range of partners can be represented. In the real work, the discussion of existing and potential partners must be deeper than this. The groups may find it useful to begin to create an inventory of government and non-governmental partners in (at least) two broad classes: partners who are now actively engaged; partners who need to be actively engaged. All good action plans include components to recruit and engage new partners.
3b. A well developed partners list allows the discussion of what works to proceed partner by partner, starting with the various partners in state government.
3b1. Think of what the state can do that is no-cost /low-cost and what it should do with it’s next dollar to turn the curve. The “next dollar” idea can help focus the discussion quickly on the most highly cost effective measures. Note that the next dollar does not have to be a “new” dollar, but the next available dollar whether new or reallocated from another use.
3b2. What can other partners do, nc/lc and next $ and how can you recruit them to be part of the process. This is the same as the state discussion but for each partner. It’s very helpful if these partners are part of this discussion, since “telling people what they should do to help” is usually counterproductive. Partners should have the opportunity to tell what they are already doing and to offer up new contributions without being pressured to do so. In the end, Everyone should get a share of the credit for the success of this work.
3b3. Of all these ideas, which ones do we most highly recommend in the short (this year), medium (next year) and longer term (3 to 5 years)? There are many ways to have this discussion and display these recommendations. In every case the groups will need to exercise judgments based on some criteria. One approach to doing this is offered in the book on pages 43 to 45, but there are certainly other possibilities. Most importantly, the groups should pay a lot of attention to no-cost and low-cost things that can be done quickly that will allow for early actions and some quick success.
3c. One line of action that is sometimes left on the cutting room floor is the idea of helping create new, or support existing, local parallel efforts. Many states have a well developed set of local councils, commissions and trusts who are natural partners in any effort to turn a statewide curve. The relationship with these bodies should be about finding common interests and partnering as equals on curves of mutual interest.
4. What would it take? Finally, there is another way to frame the “turn the curve” challenge. In the “normal” turn the curve process we ask “what works” to turn the curve as a way to generate a shopping list of ideas from which we later choose what to do. The more powerful question, however, is “what would it take?” “What would it take to significantly reduce child abuse or teen pregnancy or raise the rates of school readiness or school success?” The best analogies for this type of question come from the successful effort to invade Normandy in 1944 or land on the moon in 1969. This question is much tougher than taking on incremental progress, but it may be a perspective that top leadership should consider. Incremental progress, however it is ultimately constructed, may be more readily achieved in the context of a powerful vision for the future that can come from answering this kind of question.


